Recorded validation results
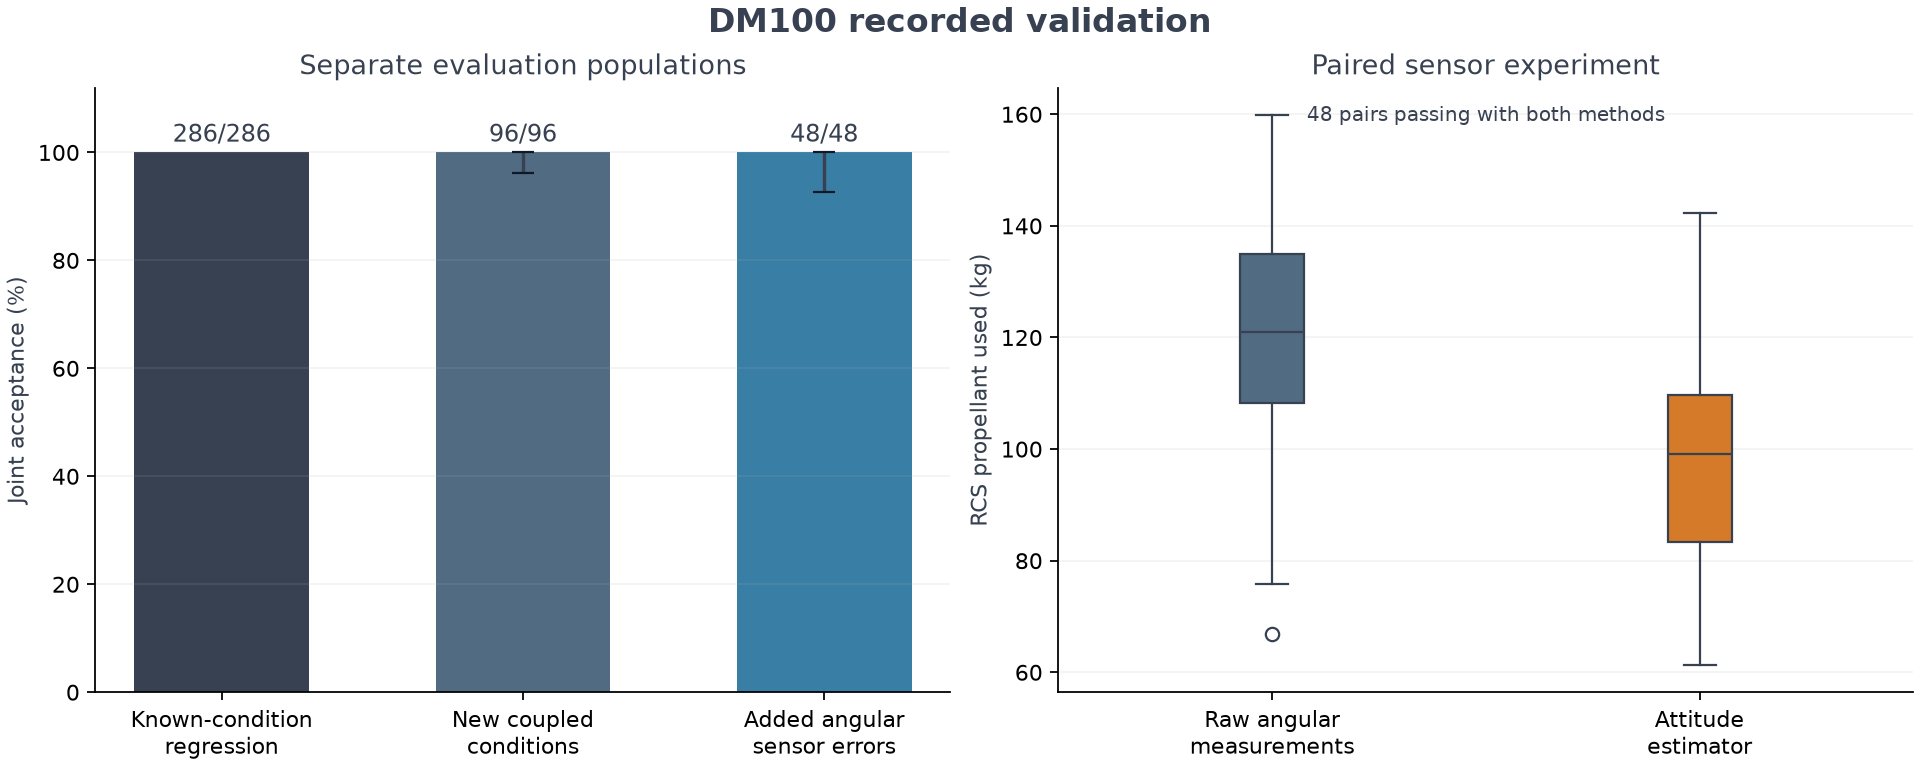
| Population | Passed / attempted |
|---|---|
| Known-condition regression | 286 / 286 |
| New coupled conditions | 96 / 96 |
| Extended sensors with estimator | 48 / 48 |
| Same sensors, raw processing | 48 / 48 |
Each population has its own denominator. The 286 known conditions are not independent evaluation. New evaluation success rates apply only to the declared synthetic sampling recipe. Worst errors across different populations do not measure improvement.
New conditions: Wilson 95% interval 96.15% to 100.00%. Extended sensors: Wilson 95% interval 92.59% to 100.00%.
Touchdown and propellant measurements
| Metric | Known 286 | New 96 | Extended sensors 48 |
|---|---|---|---|
| Position error (max) | 0.8384 m | 0.2604 m | 0.2081 m |
| Vertical foot speed (max) | 1.2551 m/s | 1.3047 m/s | 1.1285 m/s |
| Horizontal foot speed (max) | 0.2010 m/s | 0.1900 m/s | 0.1929 m/s |
| Peak dynamic pressure (max) | 28948.2858 Pa | 26787.3503 Pa | 26715.0425 Pa |
| Main propellant remaining (min) | 2958.1854 kg | 4584.8092 kg | 4587.6330 kg |
| RCS propellant remaining (min) | 95.8752 kg | 165.2481 kg | 157.6098 kg |
Failed flights remain in metric populations when the measurement exists. Contact-metric counts are recorded separately in summary.json.
Paired sensor processing comparison
Across 48 identical-condition pairs passing with both methods, median RCS consumption changed from 120.977 kg with raw angular measurements to 99.122 kg with the attitude estimator, a 18.07% reduction. Consumption decreased in 47 pairs and increased in 1 pairs. Median per-pair saving was 24.836 kg.
Success uses all 48 pairs. Fuel efficiency uses only pairs meeting acceptance with both methods. Sensor errors are assumed; this is not measured vehicle fuel savings.
| Metric on the same 48 conditions | Raw processing | Attitude estimator |
|---|---|---|
| Position error, 95th percentile | 0.1287 m | 0.1569 m |
| Maximum vertical foot speed | 1.0929 m/s | 1.1285 m/s |
| Median main propellant remaining | 5753.6334 kg | 5734.8544 kg |
The estimator improved RCS efficiency here, but not every touchdown or propellant metric. These are metric-specific tradeoffs with unchanged joint acceptance in the observed conditions.
Feature ablations
| Variant | Passed / 12 |
|---|---|
| full | 12 / 12 |
| raw-attitude | 12 / 12 |
| no-translation-bias | 11 / 12 |
| no-torque-bias | 11 / 12 |
| no-replanning | 10 / 12 |
Numerical and sensitivity checks
Across four cases at three integration intervals, acceptance agreed in 4/4 cases and all predeclared numerical tolerances held in 4/4 cases.
The finest integration interval is a comparison reference, not an exact solution. Per-case differences and one-factor sensitivity results are in analysis.json.
| Comparison metric | Maximum difference from finest step | Declared tolerance |
|---|---|---|
| Contact position | 1.82213e-05 m | 0.15 m |
| Vertical foot speed | 5.1751e-05 m/s | 0.08 m/s |
| Horizontal foot speed | 3.99511e-05 m/s | 0.05 m/s |
| Flight time | 0.000659708 s | 0.15 s |
| Main propellant remaining | 0.0413377 kg | 40 kg |
| RCS propellant remaining | 0.00489359 kg | 3 kg |
| Peak dynamic pressure | 0.159042 Pa | 100 Pa |
RK4/DOP853 comparison passed 3/3 smooth segments. Maximum normalized error was 2.906e-10, against the declared 1e-7 tolerance. This measures solver disagreement, not real-vehicle accuracy.
One-factor parameter sensitivity
The reference and thrust ±3%, drag ±15%, inertia ±3% and initial mass ±1% conditions passed in 9/9 cases. Differences below use the same other inputs and the reference case. This does not cover every simultaneous parameter combination.
| Case | Passed | Position error difference (m) | Vertical foot speed difference (m/s) | Main remaining difference (kg) | RCS remaining difference (kg) |
|---|---|---|---|---|---|
| calm-reference | True | +0 | +0 | +0 | +0 |
| sensitivity-drag_coefficient_scale-0.85 | True | +3.63209e-07 | +0.0003407 | -73.0449 | +1.07575 |
| sensitivity-drag_coefficient_scale-1.15 | True | -4.03428e-07 | -0.000355213 | +66.5353 | -0.414114 |
| sensitivity-inertia_scale-0.97 | True | +2.92066e-08 | +2.09827e-05 | -0.266326 | +0.65939 |
| sensitivity-inertia_scale-1.03 | True | -3.63331e-08 | -2.6124e-05 | +0.249987 | -0.660303 |
| sensitivity-initial_mass_scale-0.99 | True | -2.76544e-05 | +0.0131249 | +638.731 | +1.61838 |
| sensitivity-initial_mass_scale-1.01 | True | +3.00494e-05 | -0.0116883 | -634.438 | -0.464276 |
| sensitivity-thrust_scale-0.97 | True | +1.32166e-05 | -0.00537852 | -739.016 | +3.81547 |
| sensitivity-thrust_scale-1.03 | True | -1.39422e-05 | +0.00719164 | +713.848 | -1.08643 |
Check the recorded evidence
python scripts/validate_evidence.py docs/results/validation-study-v1
python -m scripts.validate_regression_evidence docs/results/regression-v1.1
Both validators use only the Python standard library and do not run flights. They check recorded evidence consistency and recompute aggregate measurements.